Did rate rises stop prices last time?
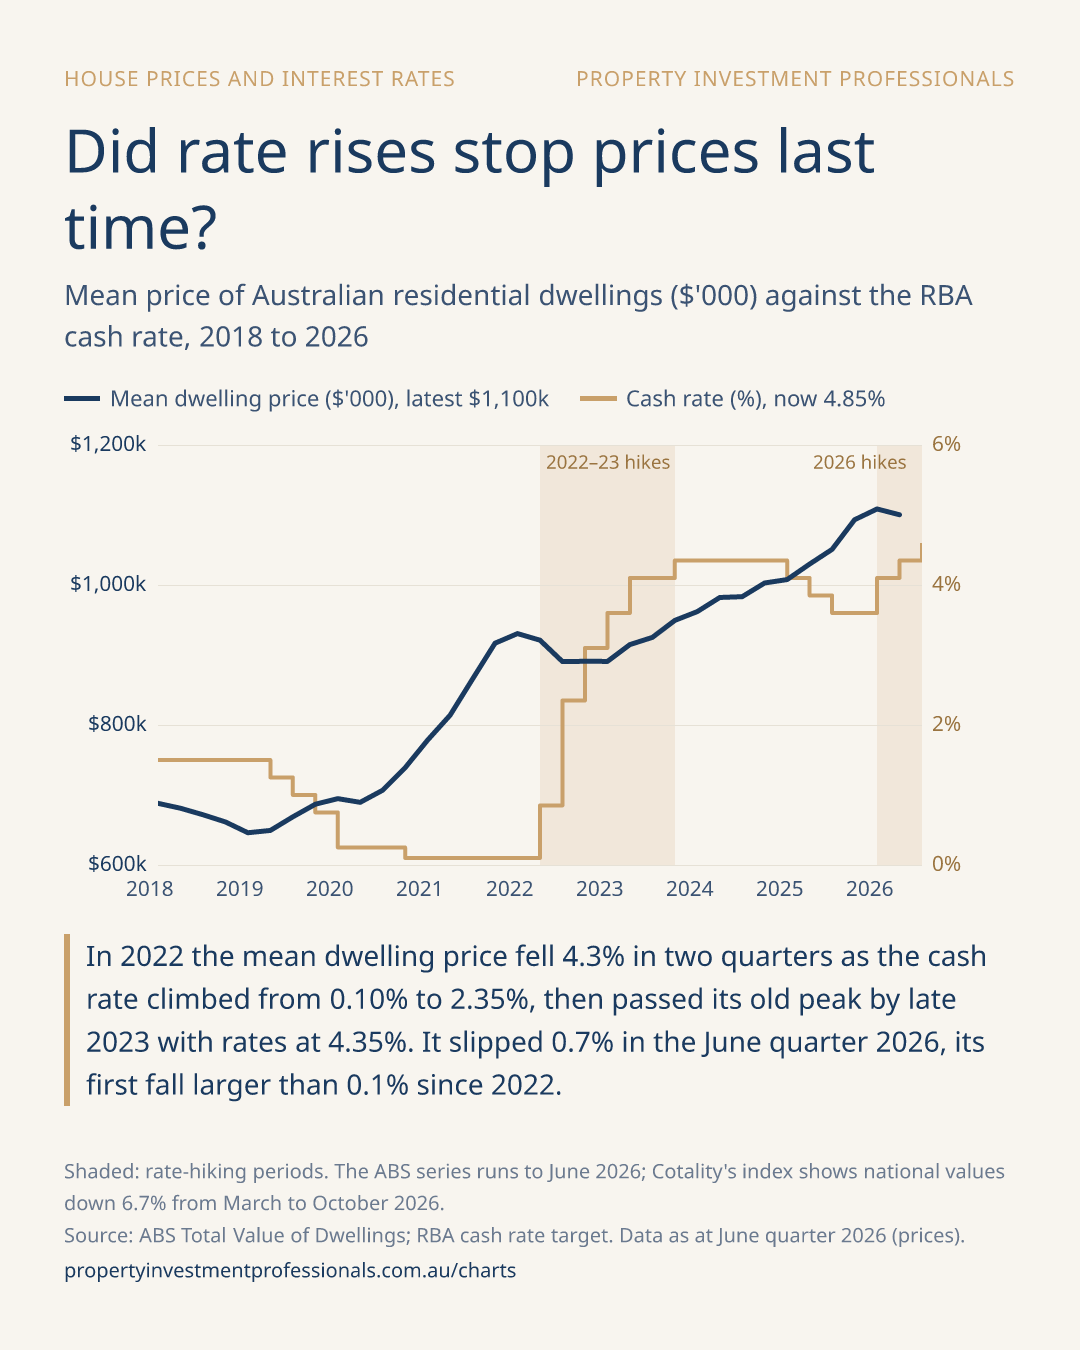
Mean price of Australian residential dwellings ($'000) against the RBA cash rate, 2018 to 2026. Data as at June quarter 2026 (prices).
Quick answer
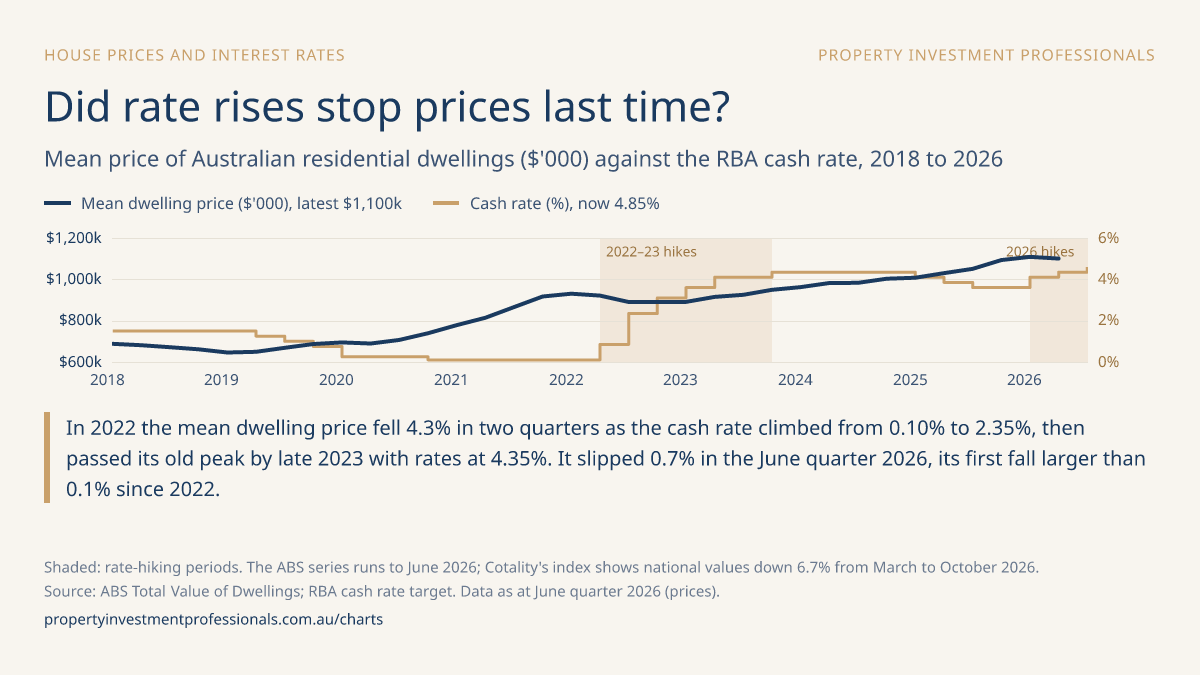
In 2022 the mean dwelling price fell 4.3% in two quarters as the cash rate climbed from 0.10% to 2.35%, then passed its old peak by late 2023 with rates at 4.35%. It slipped 0.7% in the June quarter 2026, its first fall larger than 0.1% since 2022.
The data (35 quarters)
| Quarter | Mean dwelling price ($'000) | Cash rate (%) |
|---|---|---|
| Sep qtr 2026 | – | 4.60% |
| Jun qtr 2026 | $1,100k | 4.35% |
| Mar qtr 2026 | $1,109k | 4.10% |
| Dec qtr 2025 | $1,093k | 3.60% |
| Sep qtr 2025 | $1,051k | 3.60% |
| Jun qtr 2025 | $1,030k | 3.85% |
| Mar qtr 2025 | $1,008k | 4.10% |
| Dec qtr 2024 | $1,003k | 4.35% |
| Sep qtr 2024 | $983k | 4.35% |
| Jun qtr 2024 | $982k | 4.35% |
| Mar qtr 2024 | $962k | 4.35% |
| Dec qtr 2023 | $949k | 4.35% |
| Sep qtr 2023 | $925k | 4.10% |
| Jun qtr 2023 | $915k | 4.10% |
| Mar qtr 2023 | $891k | 3.60% |
| Dec qtr 2022 | $891k | 3.10% |
| Sep qtr 2022 | $891k | 2.35% |
| Jun qtr 2022 | $921k | 0.85% |
| Mar qtr 2022 | $931k | 0.10% |
| Dec qtr 2021 | $917k | 0.10% |
| Sep qtr 2021 | $866k | 0.10% |
| Jun qtr 2021 | $814k | 0.10% |
| Mar qtr 2021 | $778k | 0.10% |
| Dec qtr 2020 | $739k | 0.10% |
| Sep qtr 2020 | $707k | 0.25% |
| Jun qtr 2020 | $689k | 0.25% |
| Mar qtr 2020 | $695k | 0.25% |
| Dec qtr 2019 | $687k | 0.75% |
| Sep qtr 2019 | $669k | 1.00% |
| Jun qtr 2019 | $649k | 1.25% |
| Mar qtr 2019 | $646k | 1.50% |
| Dec qtr 2018 | $661k | 1.50% |
| Sep qtr 2018 | $672k | 1.50% |
| Jun qtr 2018 | $681k | 1.50% |
| Mar qtr 2018 | $688k | 1.50% |
Shaded: rate-hiking periods. The ABS series runs to June 2026; Cotality's index shows national values down 6.7% from March to October 2026. Source: ABS Total Value of Dwellings; RBA cash rate target. Data as at June quarter 2026 (prices).
Monthly prices: Home Value Index Tracker →Share this chart
Free to share with a credit to Property Investment Professionals and a link to this page. Download: portrait (1080×1350) · wide (1200×675).
General information only, not financial advice.
More charts
The Sunday read for Australian property investors
Auction clearance, prices, vacancy and the RBA, read from the primary data every Sunday. Plus the sell-or-hold countdown to the 1 July 2027 tax changes. Independent, nothing to sell.
Free. Unsubscribe in one click.