Property Market Charts
The numbers Australian property investors search for most, charted from the primary releases. Each chart carries its source and date. Updated with the Sunday newsletter.
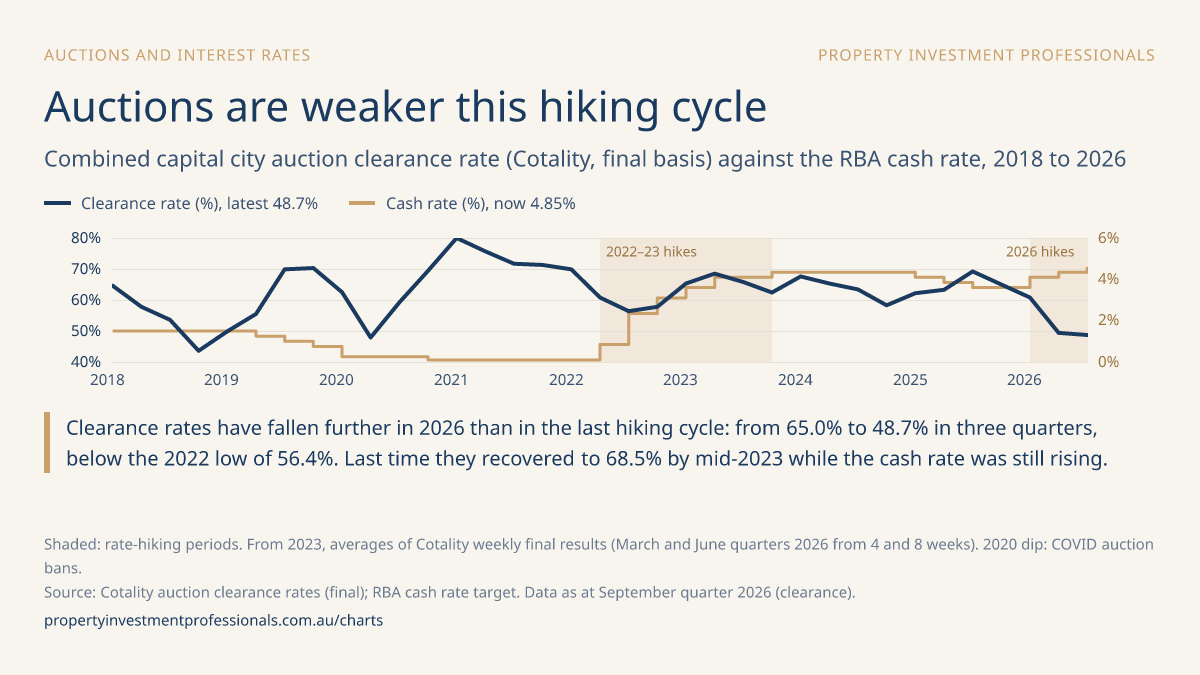
Auctions and interest rates
Auctions are weaker this hiking cycle
Clearance rates have fallen further in 2026 than in the last hiking cycle: from 65.0% to 48.7% in three quarters, below the 2022 low of 56.4%. Last time they recovered to 68.5% by mid-2023 while the cash rate was still rising.
Source: Cotality auction clearance rates (final); RBA cash rate target. Data as at September quarter 2026 (clearance).
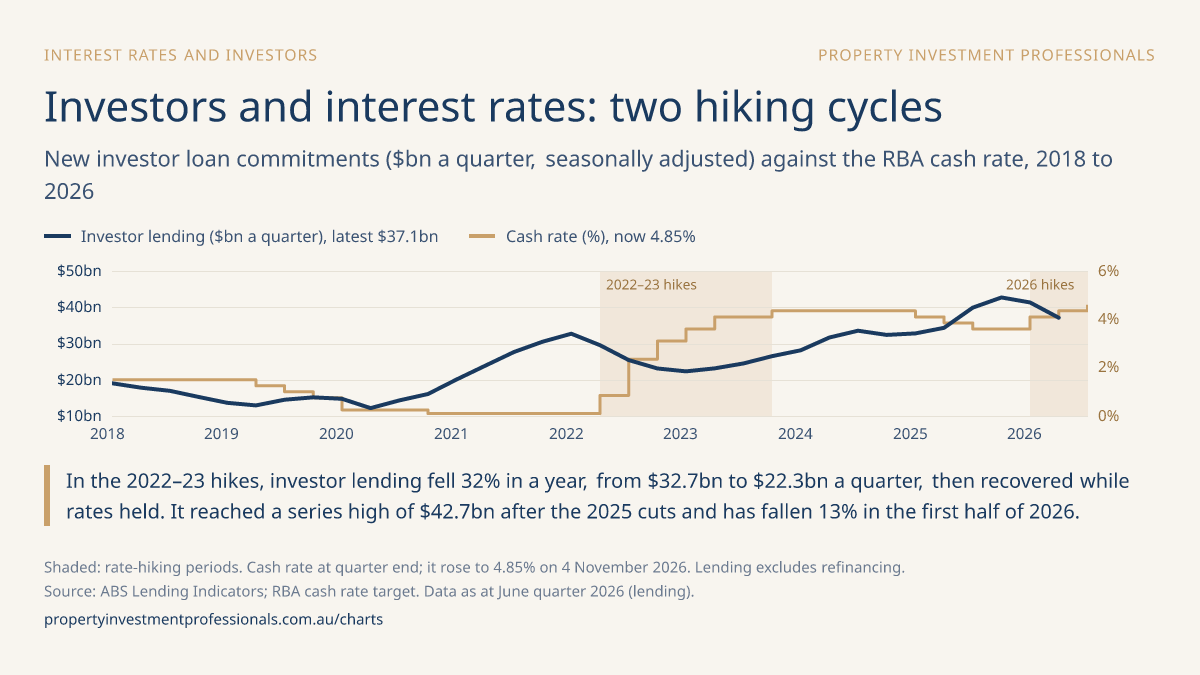
Interest rates and investors
Investors and interest rates: two hiking cycles
In the 2022–23 hikes, investor lending fell 32% in a year, from $32.7bn to $22.3bn a quarter, then recovered while rates held. It reached a series high of $42.7bn after the 2025 cuts and has fallen 13% in the first half of 2026.
Source: ABS Lending Indicators; RBA cash rate target. Data as at June quarter 2026 (lending).
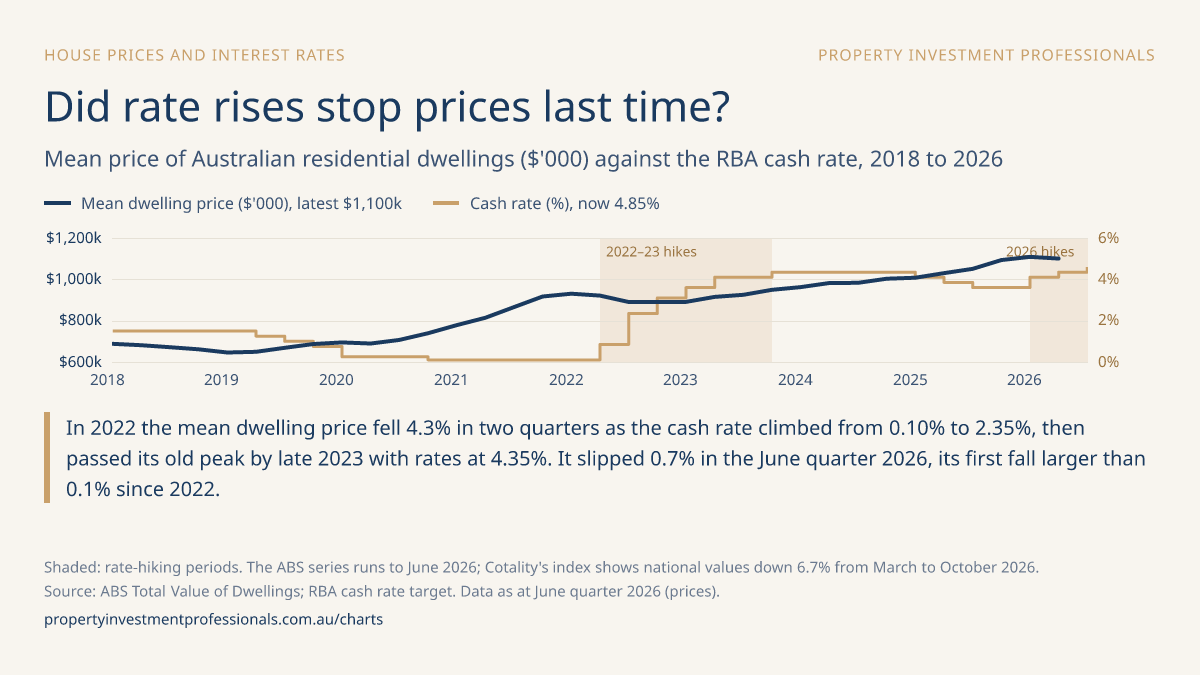
House prices and interest rates
Did rate rises stop prices last time?
In 2022 the mean dwelling price fell 4.3% in two quarters as the cash rate climbed from 0.10% to 2.35%, then passed its old peak by late 2023 with rates at 4.35%. It slipped 0.7% in the June quarter 2026, its first fall larger than 0.1% since 2022.
Source: ABS Total Value of Dwellings; RBA cash rate target. Data as at June quarter 2026 (prices).
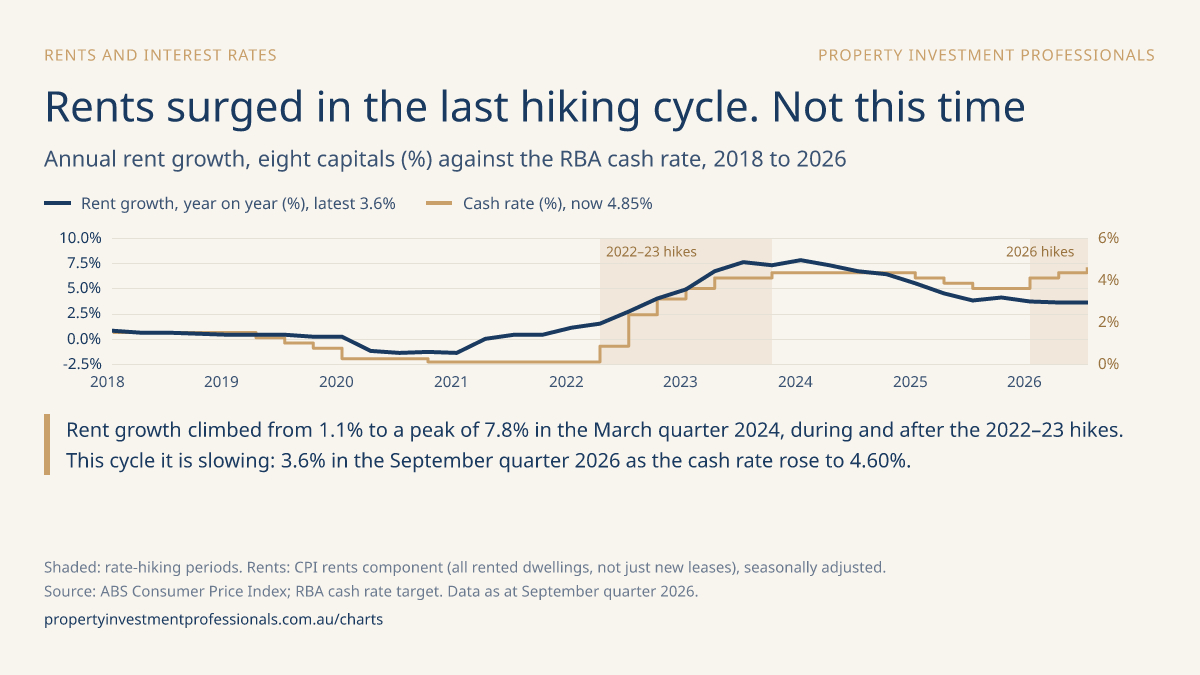
Rents and interest rates
Rents surged in the last hiking cycle. Not this time
Rent growth climbed from 1.1% to a peak of 7.8% in the March quarter 2024, during and after the 2022–23 hikes. This cycle it is slowing: 3.6% in the September quarter 2026 as the cash rate rose to 4.60%.
Source: ABS Consumer Price Index; RBA cash rate target. Data as at September quarter 2026.
Capital gains tax reform
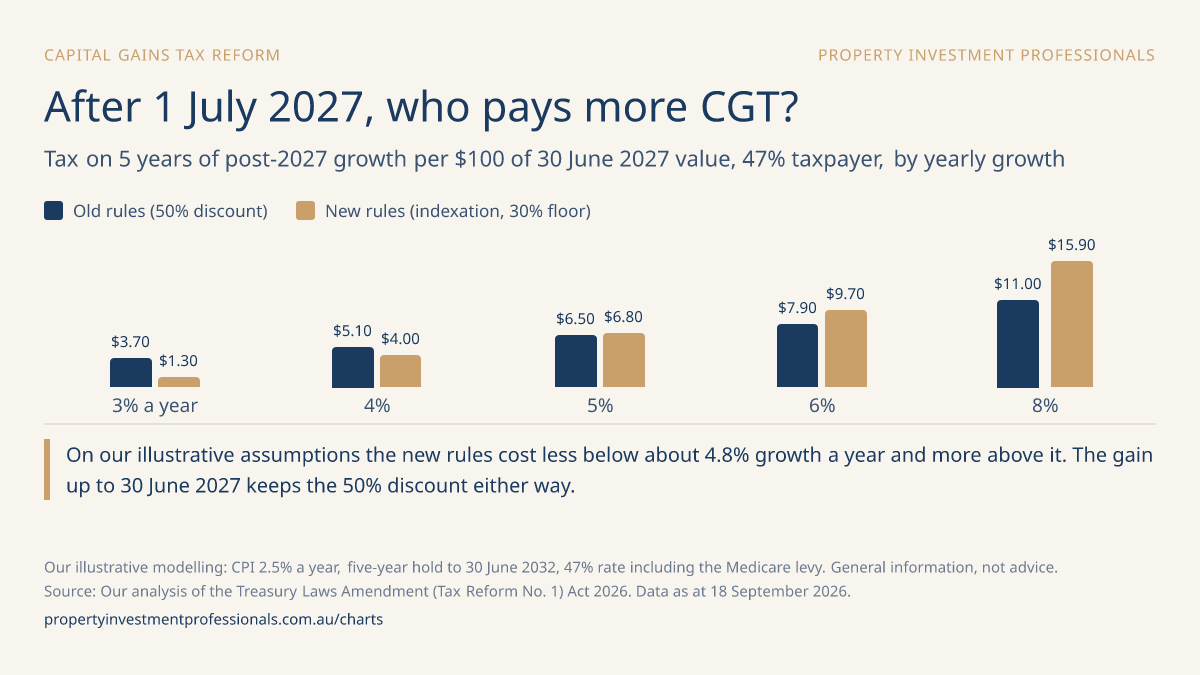
After 1 July 2027, who pays more CGT?
On our illustrative assumptions the new rules cost less below about 4.8% growth a year and more above it. The gain up to 30 June 2027 keeps the 50% discount either way.
Source: Our analysis of the Treasury Laws Amendment (Tax Reform No. 1) Act 2026. Data as at 18 September 2026.
You're welcome to share these charts. Please credit Property Investment Professionals and link to the chart's page. Third-party figures belong to their publishers, named on each chart.
The Sunday read for Australian property investors
Auction clearance, prices, vacancy and the RBA, read from the primary data every Sunday. Plus the sell-or-hold countdown to the 1 July 2027 tax changes. Independent, nothing to sell.
Free. Unsubscribe in one click.