House approvals are rising as rates go up
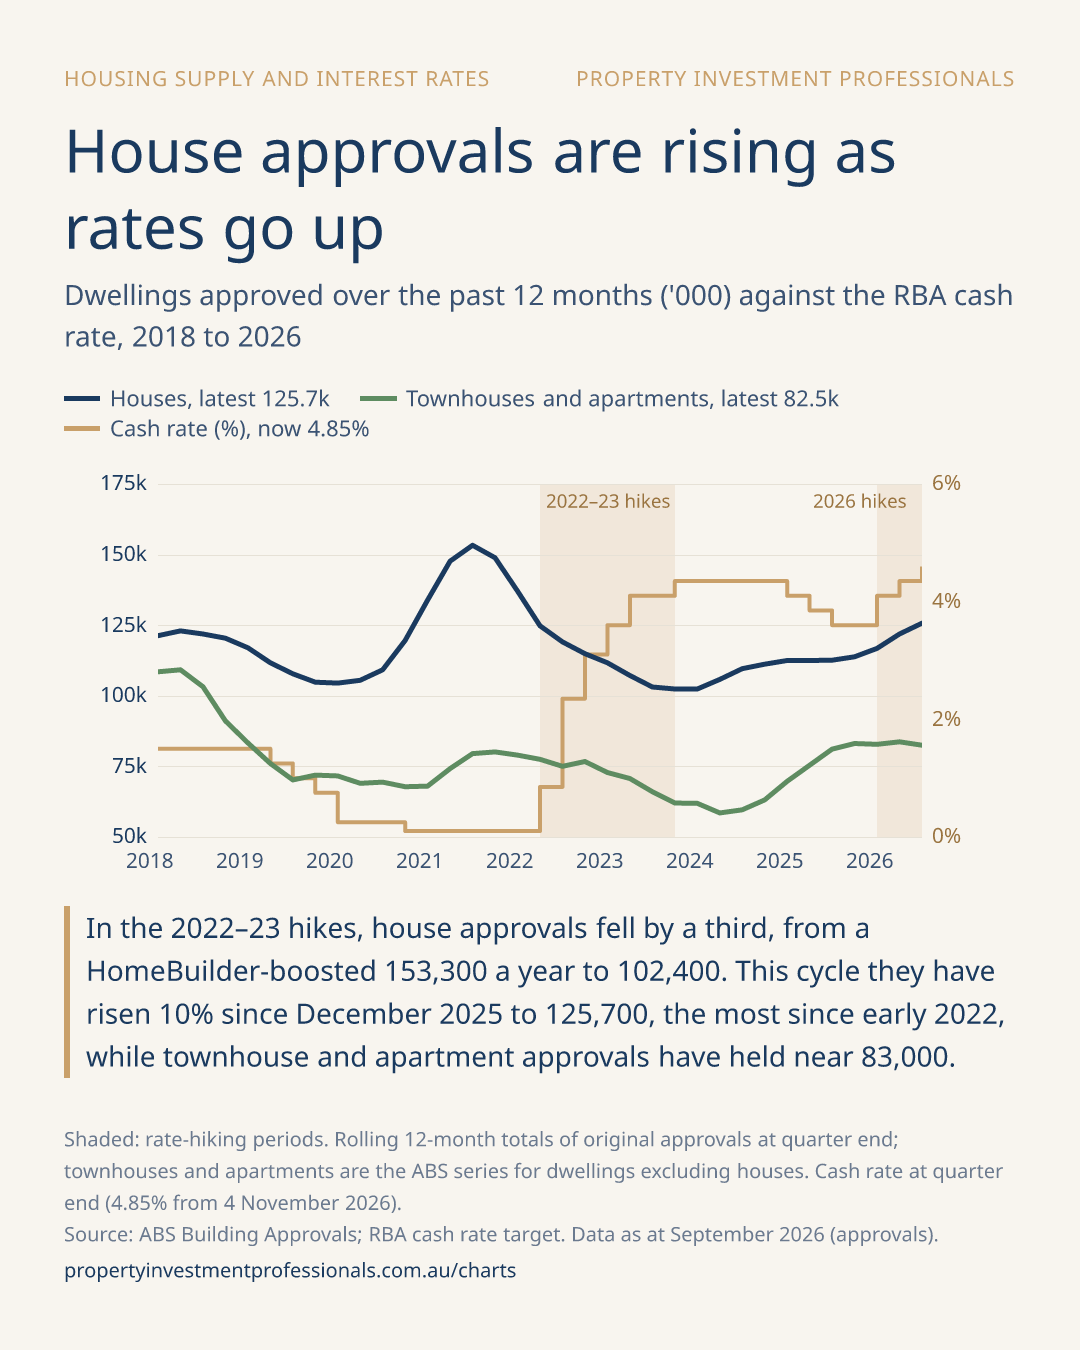
Dwellings approved over the past 12 months ('000) against the RBA cash rate, 2018 to 2026. Data as at September 2026 (approvals).
Quick answer
In the 2022–23 hikes, house approvals fell by a third, from a HomeBuilder-boosted 153,300 a year to 102,400. This cycle they have risen 10% since December 2025 to 125,700, the most since early 2022, while townhouse and apartment approvals have held near 83,000.
The data (35 quarters)
| Quarter | Houses | Townhouses and apartments | Cash rate (%) |
|---|---|---|---|
| Sep qtr 2026 | 125.7k | 82.5k | 4.60% |
| Jun qtr 2026 | 121.9k | 83.7k | 4.35% |
| Mar qtr 2026 | 116.8k | 82.8k | 4.10% |
| Dec qtr 2025 | 113.8k | 83.1k | 3.60% |
| Sep qtr 2025 | 112.6k | 81.1k | 3.60% |
| Jun qtr 2025 | 112.5k | 75.4k | 3.85% |
| Mar qtr 2025 | 112.5k | 69.7k | 4.10% |
| Dec qtr 2024 | 111.2k | 63.1k | 4.35% |
| Sep qtr 2024 | 109.6k | 59.6k | 4.35% |
| Jun qtr 2024 | 105.8k | 58.5k | 4.35% |
| Mar qtr 2024 | 102.4k | 61.9k | 4.35% |
| Dec qtr 2023 | 102.4k | 62.0k | 4.35% |
| Sep qtr 2023 | 103.1k | 66.0k | 4.10% |
| Jun qtr 2023 | 107.2k | 70.7k | 4.10% |
| Mar qtr 2023 | 111.7k | 72.8k | 3.60% |
| Dec qtr 2022 | 114.9k | 76.7k | 3.10% |
| Sep qtr 2022 | 119.1k | 75.0k | 2.35% |
| Jun qtr 2022 | 124.8k | 77.5k | 0.85% |
| Mar qtr 2022 | 137.1k | 79.0k | 0.10% |
| Dec qtr 2021 | 148.9k | 80.1k | 0.10% |
| Sep qtr 2021 | 153.3k | 79.5k | 0.10% |
| Jun qtr 2021 | 147.7k | 74.2k | 0.10% |
| Mar qtr 2021 | 133.9k | 68.0k | 0.10% |
| Dec qtr 2020 | 119.6k | 67.8k | 0.10% |
| Sep qtr 2020 | 109.2k | 69.4k | 0.25% |
| Jun qtr 2020 | 105.5k | 69.0k | 0.25% |
| Mar qtr 2020 | 104.5k | 71.6k | 0.25% |
| Dec qtr 2019 | 104.8k | 71.9k | 0.75% |
| Sep qtr 2019 | 107.8k | 70.2k | 1.00% |
| Jun qtr 2019 | 111.7k | 76.0k | 1.25% |
| Mar qtr 2019 | 117.0k | 83.3k | 1.50% |
| Dec qtr 2018 | 120.4k | 91.1k | 1.50% |
| Sep qtr 2018 | 121.9k | 103.2k | 1.50% |
| Jun qtr 2018 | 123.0k | 109.2k | 1.50% |
| Mar qtr 2018 | 121.3k | 108.5k | 1.50% |
Shaded: rate-hiking periods. Rolling 12-month totals of original approvals at quarter end; townhouses and apartments are the ABS series for dwellings excluding houses. Cash rate at quarter end (4.85% from 4 November 2026). Source: ABS Building Approvals; RBA cash rate target. Data as at September 2026 (approvals).
What building approvals mean for investors →Share this chart
Free to share with a credit to Property Investment Professionals and a link to this page. Download: portrait (1080×1350) · wide (1200×675).

General information only, not financial advice.
More charts
The Sunday read for Australian property investors
Auction clearance, prices, vacancy and the RBA, read from the primary data every Sunday. Plus the sell-or-hold countdown to the 1 July 2027 tax changes. Independent, nothing to sell.
Free. Unsubscribe in one click.